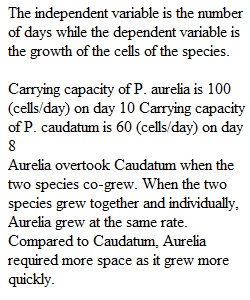
Q WEEK 8 EXPERIMENT ANSWER SHEET Please submit to the Week 8 Experiment dropbox no later than Sunday midnight. SUMMARY OF ACTIVITIES FOR WEEK 8 EXPERIMENT ASSIGNMENT • Experiment 8 Exercise 1 – Species Interactions: Competition • Experiment 8 Exercise 2 – Biomes (Part I and II) Experiment 8 Exercise 1: Species Interactions: Competition In this exercise you will be evaluating the effect of competition on the population size of two species of microorganisms. Be sure you have read through the readings for Week 8 as well as the introductory information for the Week 8 Experiment. You will use the following data to answer the questions. Table 1. Grown Separately (cells per ml) Grown Together (cells/ml) Day P. caudatum P. aurelia P. caudatum P. aurelia 0 2 2 2 2 2 10 8 10 6 4 28 50 20 66 6 50 86 20 80 8 60 96 16 80 10 58 100 6 88 12 58 96 4 94 14 58 96 0 96 16 58 98 0 96 A. Now it is time to analyze your data. a. You will need to generate two graphs, one which depicts the number of both species per day of culture when grown separately and one that depicts the number of both species per day of culture when grown together. b. You must use the Scatter type graph in Excel and each graph should have two lines (one for each species). c. Be sure you label your axes and your series; meaning you will need to indicate which line pertains to P. caudatum and which to P. aurelia. Paste your two graphs below (4 pts): Questions 1. What were the dependent and independent variables for the experiment? (2 pts) 2. What were the carrying capacities (maximum population size) for the two species when grown separately and on what day were they reached (2 pts)? 3. Describe what happened when the two species were grown together and explain why. Be sure to discuss the magnitude and timing of each species’ carrying capacity compared to when they were grown separately (4 pts). 4. Do these results support the principle of competitive exclusion; why or why not? Be sure to cite your sources. (4 pts). 5. Think about what would if additional food was placed in the test tube containing both the species. How might this change the results? (2 pts) Experiment 8 Exercise 2: Biomes In these two relatively short exercises, we will be examining the biotic and abiotic factors that define a biome. You should have completed the readings for this week before beginning. Procedure - Part I: The Great Graph Match A. Open the following website: NASA. No date. The Great Graph Match http://earthobservatory.nasa.gov/Experiments/Biome/graphmatch_advanced.php B. In the Great Graph Match, you will need to match abiotic information (annual rainfall and temperatures) to the appropriate biome. Follow the instructions on the page and fill-in the Table below. For the Explanation column, you need to briefly explain why you chose the biome you did based on the data presented. C. Be sure to provide complete citations for the sources used. Table 2. Locations, biomes and explanations (4 pts). Location Biome Explanation Frogmore, England Goteborg, Sweden Koombooloomba, Australia Barrow, Alaska Alice Springs, Australia San Bernadino, California Centralia, Kansas Citations: Procedure - Part II: To Plant or Not to Plant A. Open the following website: NASA. No date. To Plant or Not to Plant https://earthobservatory.nasa.gov/biome/plantindex.php B. In the To Plant or not to Plant, you will need to determine which in which biomes to plant various plants, based on the information presented. Follow the instructions on the page and fill-in the Table below. For the Explanation column, you need to briefly explain why you chose the biome you did. C. Be sure to provide complete citations for the sources used. Table 3. Plants, biomes and explanations (4 pts). Plant Biome Explanation Creosote bush Spruce Flowering dogwood Orchid Lichen Bluestem grasses White sage Saguaro cactus Citations: ________________________________________ Week 8 Experiment Grading Rubric Component Expectation Points Experiment 8 Exercise 1 Correctly generates two graphs. 4 pts Experiment 8 Exercise 1 Demonstrates an understanding competition between species and the effect it has on population growth (Questions 1-5). 14 pts Experiment 8 Exercise 2 Develops an appreciation of the diversity of ecosystems around the globe and understands the environmental conditions that lead to their development (Tables 2 and 3). 8 pts TOTAL 26 pts
View Related Questions